In two previous blog posts, we’ve looked into how the choice of data, features and models affects xG. One remaining aspect that we ignored up to now is the effect that the choice of data provider has on xG. It is worth noting that Opta, Statsbomb, Wyscout, Metrica, InStat and all other data providers have their own data quality problems and use different event definitions. Hence, one might wonder whether a different data source would lead to different xG values and different results when analyzing games or evaluating players. Therefore, we address the following four questions in this blog post:
- How does the data representation of shots differ between different data providers?
- What is the effect on the accuracy of the learned models? Does one data provider lead to more accurate models than the other or do we need more data to achieve the same accuracy?
- Can we exploit the differences between the data providers to obtain more accurate models by combining multiple data sources?
- What is the practical impact of these differences? That is, do the obtained xG values differ significantly between providers and does this lead to different results for evaluating players or teams?
Differences between data providers
In essence, all event data providers collect the same data: a timestamp, the location on the pitch (i.e., a (x,y) position), a type (e.g., pass, cross, or foul), and the players who are involved in each noteworthy event on the pitch. Nevertheless, the data can differ significantly between providers. As an example, consider how two data providers labelled all shots in a recent Premier League game:
Even for a basic action like a shot, there are three major differences:
- The locations of shots can vary up to a couple of meters between data providers. These differences arise due to the tracking of the events by human annotators, who have to determine the right location and type of each event. This is hard to do, especially in a near real-time setting.
- All providers use different definitions for labelling shots. For example, some providers will count shots that are blocked immediately at the feet of the player, others won’t. This is illustrated by the three blue-labeled shots, which are not included in the event stream of provider B. That is not a mistake. They simply do not comply with what provider B considers to be a shot.
- Data providers also include different bits of additional information in their event streams. For example, Opta has the “big chance” feature and Statsbomb includes the positions of all defenders and the goalkeeper. For now, we ignore these and focus on provider-agnostic xG models.
Effects on model accuracy
To verify whether these differences affect the xG classifiers, we repeated the three experiments from our previous blog post on a different provider (which we refer to as provider B below). That is, we look at the amount of training data needed to train a model, whether the accuracy of the models decreases if older data is included and whether xG models can be trained on data from multiple leagues. Additionally, we tried to train the models on data from different providers. For simplicity, we only include the results of our gradient boosted probability trees model with advanced features.
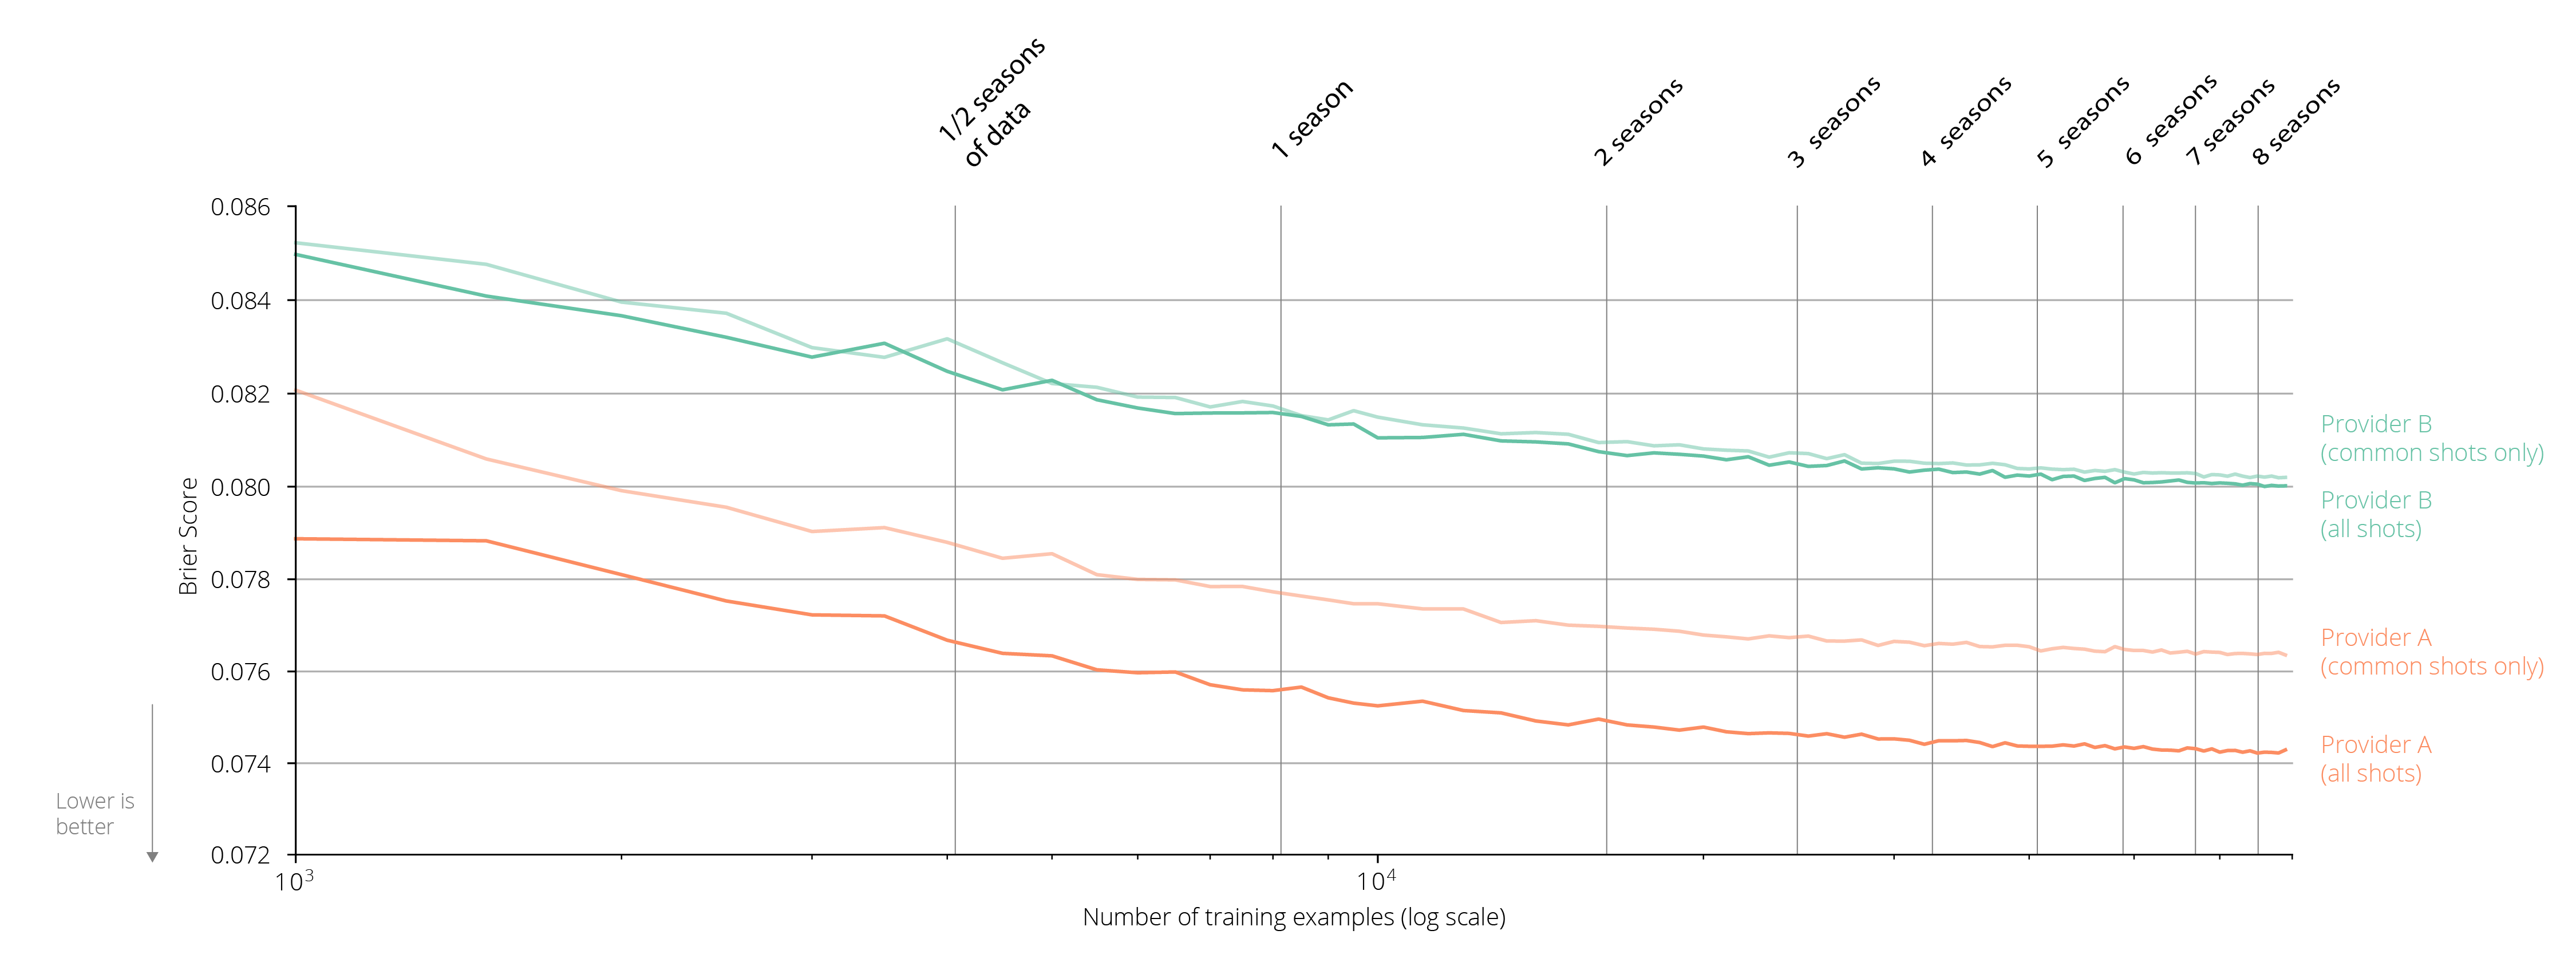
Starting with the amount of training data needed, the figure below plots the Brier score for all shots in the 2018/2019 top-5 European leagues as a function of the number of shot attempts included in the training set. This training set is constructed by randomly sampling shots from the 2016/2017 and 2017/2018 seasons. For both providers, about 5 seasons of training data are required. More interesting, however, is the large difference in Brier scores between both providers. This is partly due to less accurate shot locations in provider B, partly because provider B excludes a category of shots which are in general easier to predict. When these shots are excluded from the test set of provider A (by only evaluating on common shots), its Brier score gets worse too.

In conclusion, the data accuracy and event definitions can have a small impact on the accuracy of the learned models, but the general conclusions in terms of data needed remain valid. The same applies to the recency and league effects. Hence, if limited data is available, training models on less recent data or different leagues is still a viable solution.
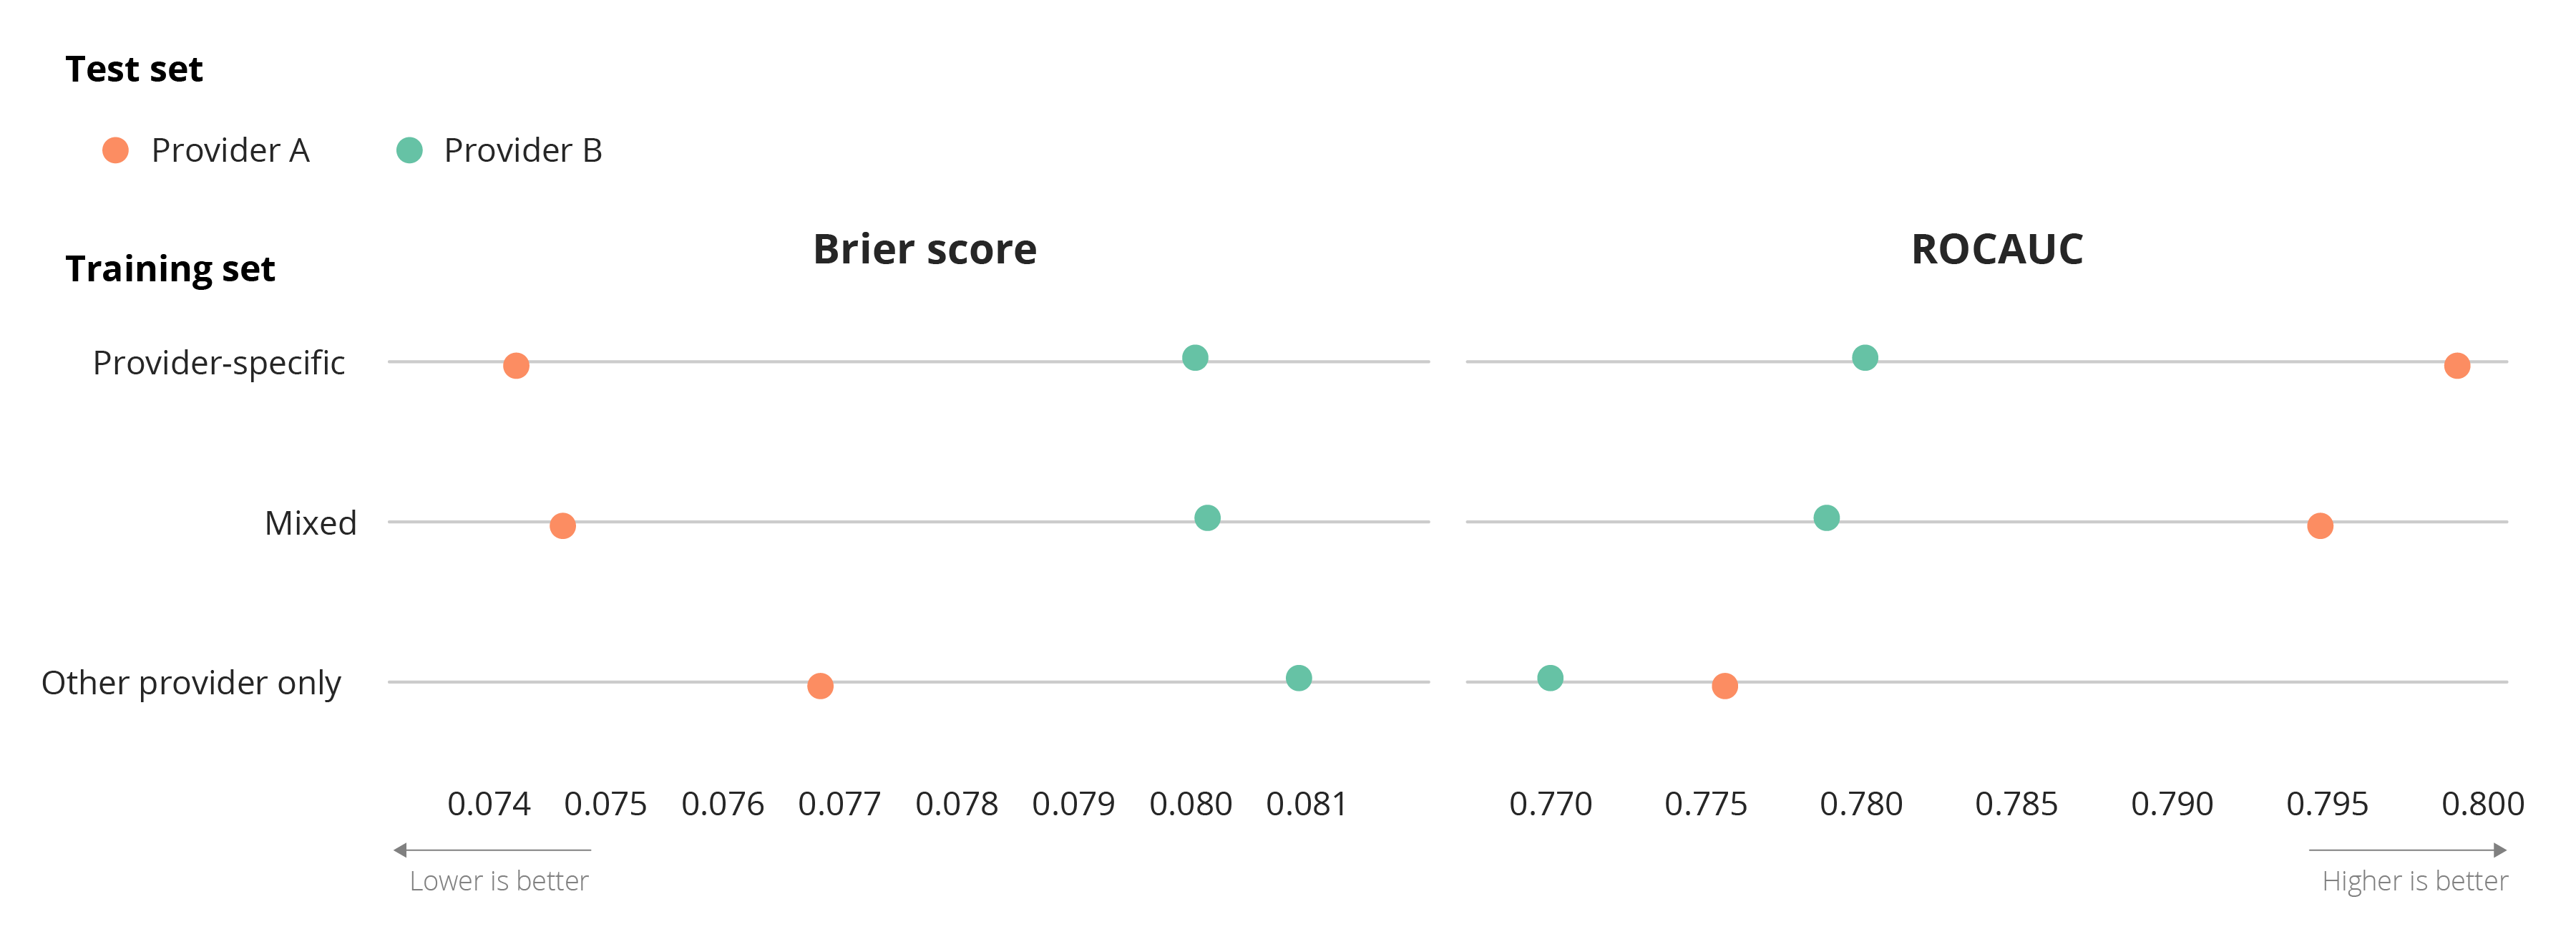
With several providers making small sets of data publicly available, a logical follow up question would be whether we can also combine data from different providers. Therefore, we create one test set for each provider that consists of data from the 2018/2019 season and vary the data in the training set, considering three types of models:
- A provider-specific model that uses only data from the same provider as the test set
- A mixed model that uses data from both providers in the test set
- A model that uses only data from the other provider
As the figure below illustrates, mixing data from different sources is not a good idea, however. The training data and test data will no longer have the same distribution. To be able to do this successfully one would need advanced domain adaptation techniques.

Exploiting data provider inaccuracies
When sufficient data of multiple providers is available for the same set of games, it might be possible to obtain more accurate xG values by combining these data sources. To verify this, we first trained a model on the event data of provider A and a model on the event data of provider B. Subsequently, we obtained xG values from both models including only the shots that are included in the event streams of both providers. Third, we evaluated three possible approaches to combine the obtained xG values on the common shots:
- A model combining the predictions of the two models as an equally weighted average.
- A model combining the predictions of the two models as an optimal weighted average, tuned on the training set.
- A model combining the predictions of the two models as a weighted average, using the binned calibration errors of each model to determine the weight.
- A stacked model using the xG values predicted by each model as input to a logistic regression model.
As the table below illustrates, combining the data sources can indeed improve the results. The optimal weighted average has both a better Brier and AUROC score than the models trained on a single provider. However, the difference is small and might improve by adding more data sources.
| Brier | AUROC | |
| Provider A | 0.07840 | 0.7962 |
| Provider B | 0.08020 | 0.7778 |
| Equally weighted | 0.07770 | 0.7986 |
| Optimal weighted | 0.07759 | 0.8012 |
| Bin weighted | 0.07781 | 0.7934 |
| Stacked model | 0.07895 | 0.8000 |
Practical impact
Rather than the accuracy of the learned models, the much more important question is how these differences affect the xG metric. Since the locations of individual shots can differ a couple of meters between data providers, the xG value of individual shots can differ significantly too, especially for shots from close range. On the other hand, when aggregated xG values are used, these errors are expected to cancel each other out. To test this assumption, we look at two common applications of xG: summing the xG values of all shots per team to infer which team created most offensive threat during a game and ranking players.
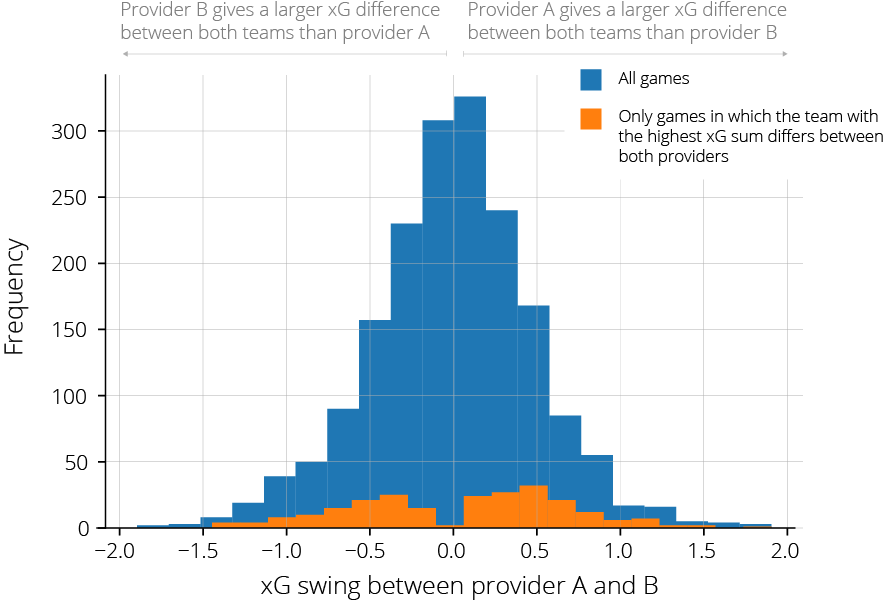
Looking back at the earlier example, we can see that the summed xG values differ significantly between both data providers. Moreover, according to provider’s A data, the home team was more threatening; while the away team created more danger according to the data of provider B. Hence, the choice of data provider leads to opposite insights here.
Although this example was chosen with premeditation, it is definitely not unique. The same happens in 238 or 13% of all games in the 2018/2019 season of the top-5 European leagues.

While a team shoots on average only 12 times on goals per game, most strikers accumulate somewhere between 50 and 200 shots per season. Therefore, player-based xG sums are more stable between providers, as the tables below illustrate for the 2018/2019 season.
| # | Player | xG |
|---|---|---|
| 1 | Aubameyang | 20.48 |
| 2 | Aguero | 19.14 |
| 3 | Salah | 18.94 |
| 4 | Mane | 16.20 |
| 5 | Sterling | 15.19 |
| 6 | Mitrovic | 14.99 |
| 7 | Jimenez | 14.93 |
| 8 | Wilson | 13.84 |
| 9 | Firmino | 13.69 |
| 10 | Vardy | 13.33 |
| # | Player | xG |
|---|---|---|
| 1 | Aguero | 20.62 |
| 2 | Salah | 19.92 |
| 3 | Aubameyang | 17.77 |
| 4 | Mitrovic | 16.82 |
| 5 | Jimenez | 15.97 |
| 6 | Mane | 15.70 |
| 7 | Sterling | 14.66 |
| 8 | Wilson | 14.11 |
| 9 | Vardy | 13.46 |
| 10 | Rondon | 12.76 |
Although the raw numbers can differ considerably between the providers, for the most part the same players appear at the top of the rankings. The latter is ultimately the most important thing when the xG metric is used for scouting players. As long as the ranking is “good”, the raw numbers do not play such an important role to identify prominent players in a league.
Conclusions
Data quality is a highly debated topic in the field of soccer analytics. On one hand, this blog post showed that the annotation accuracy indeed matters. The annotated shot locations can differ significantly between data providers, resulting in different models and sometimes very different xG values for the same shots. On the other hand, data quality is mainly important for analyzing small amounts of data. An important nuance that is often lacking in the discussion about the quality of soccer data is the ultimate goal of the metrics that are built on the data. The perception is often that every metric is developed to analyze individual matches, but that is often not the case. Scouting players, for example, mainly involves patterns and insights across multiple matches or even entire seasons. For such applications, availability or coverage is often much more important than the quality of the data, as long as a certain quality is guaranteed.