


Coming from a background in machine learning and artificial intelligence, one of the things that interests us is data and in particular, how the available data affects our ability to learn good models. This will be the first in a series of blogposts that explores aspects related to data in the context of soccer analytics, which we feel is an underexplored topic.
We will begin our exploration of data using expected goals (xG) models because, for better or worse, they are among the most commonly used and best understood models. In this post, we will look at using event stream data to answer the following three questions:
- How much data is needed to train an accurate xG model?
- Does data go out of date? That is, does training a model using data from more recent seasons result in improved performance compared to using data from older seasons?
- What is the effect of training an xG model using data from multiple leagues on performance? Does training a league-specific xG model result in improved performance?
Methodology
Our goal is not to explore the complete space of design choices to arrive at the best possible xG model, but to mimic reasonable setups. To this end, we will consider two feature sets and two standard models.
- Basic: This simply consists of the following 5 features about the shot attempt: the x and y location of the shot, the distance to the goal, the angle to the goal, and the body part used to take the shot (i.e., head, foot or body)
- Advanced: This consists of 47 features constructed using the shot itself plus the previous two actions. These features encode the velocity of the possession, whether the assist was a through ball or a corner, whether the ball changed possession, etc.
- Logistic regression
- Gradient boosted probability trees
In all experiments, we only consider shots from open play and hence omit penalties and shots from free kicks. 1
We believe that the primary objective of an expected goals model should be to produce calibrated probability estimates. That is, the predicted probabilities should correspond to what is expected to happen in reality: when a shot is given an xG value of 0.3, this essentially means that if that one shot was taken a hundred times, it is expected to result in a goal 30 times. However, this cannot be assessed for a single shot, since each shot is taken only once. Therefore, one typically groups shots with similar xG values in bins and calculates the fraction of shots in each bin that actually resulted in a goal. Ideally, in the bin containing xG values of about x%, about x% of the shots should have resulted in a goal. This is reflected in the probability calibration curve below:

Many past works do not evaluate the calibration of their models and report the area under the ROC curve (AUROC). However, AUROC only considers the relative ranking of examples (i.e., whether one shot is more or less likely to result in a goal than another shot) and ignores the actual predicted probabilities. This means that a classifier can be poorly calibrated, yet still achieve an excellent AUROC. In contrast, we will report the Brier score2
where is the predicted xG value of shot i and is 1 if shot results in a goal and 0 otherwise. This is a proper scoring rule that can only be minimized by reporting well-calibrated probabilities. While we would like to stress that we do not find AUROC to be an appropriate choice for evaluating xG models, we will report it as many past works have used AUROC to evaluate xG models so it may help place what we have done in context.
1. How much data is needed to train an accurate xG model?
The figure below plots the Brier score for all shots in the 2018/2019 EPL season as a function of the number of shot attempts included in the training set. This training set is constructed by randomly sampling shots from the 2012/2013 to 2017/2018 EPL seasons. Because the training set differs for each sample size, we repeat this process 10 times and report the mean ± std Brier score for each sample size.
| All models ▼ | Logistic regression + basic features | Logistic regression + advanced features | Boosted trees + basic features | Boosted trees + advanced features |
|---|
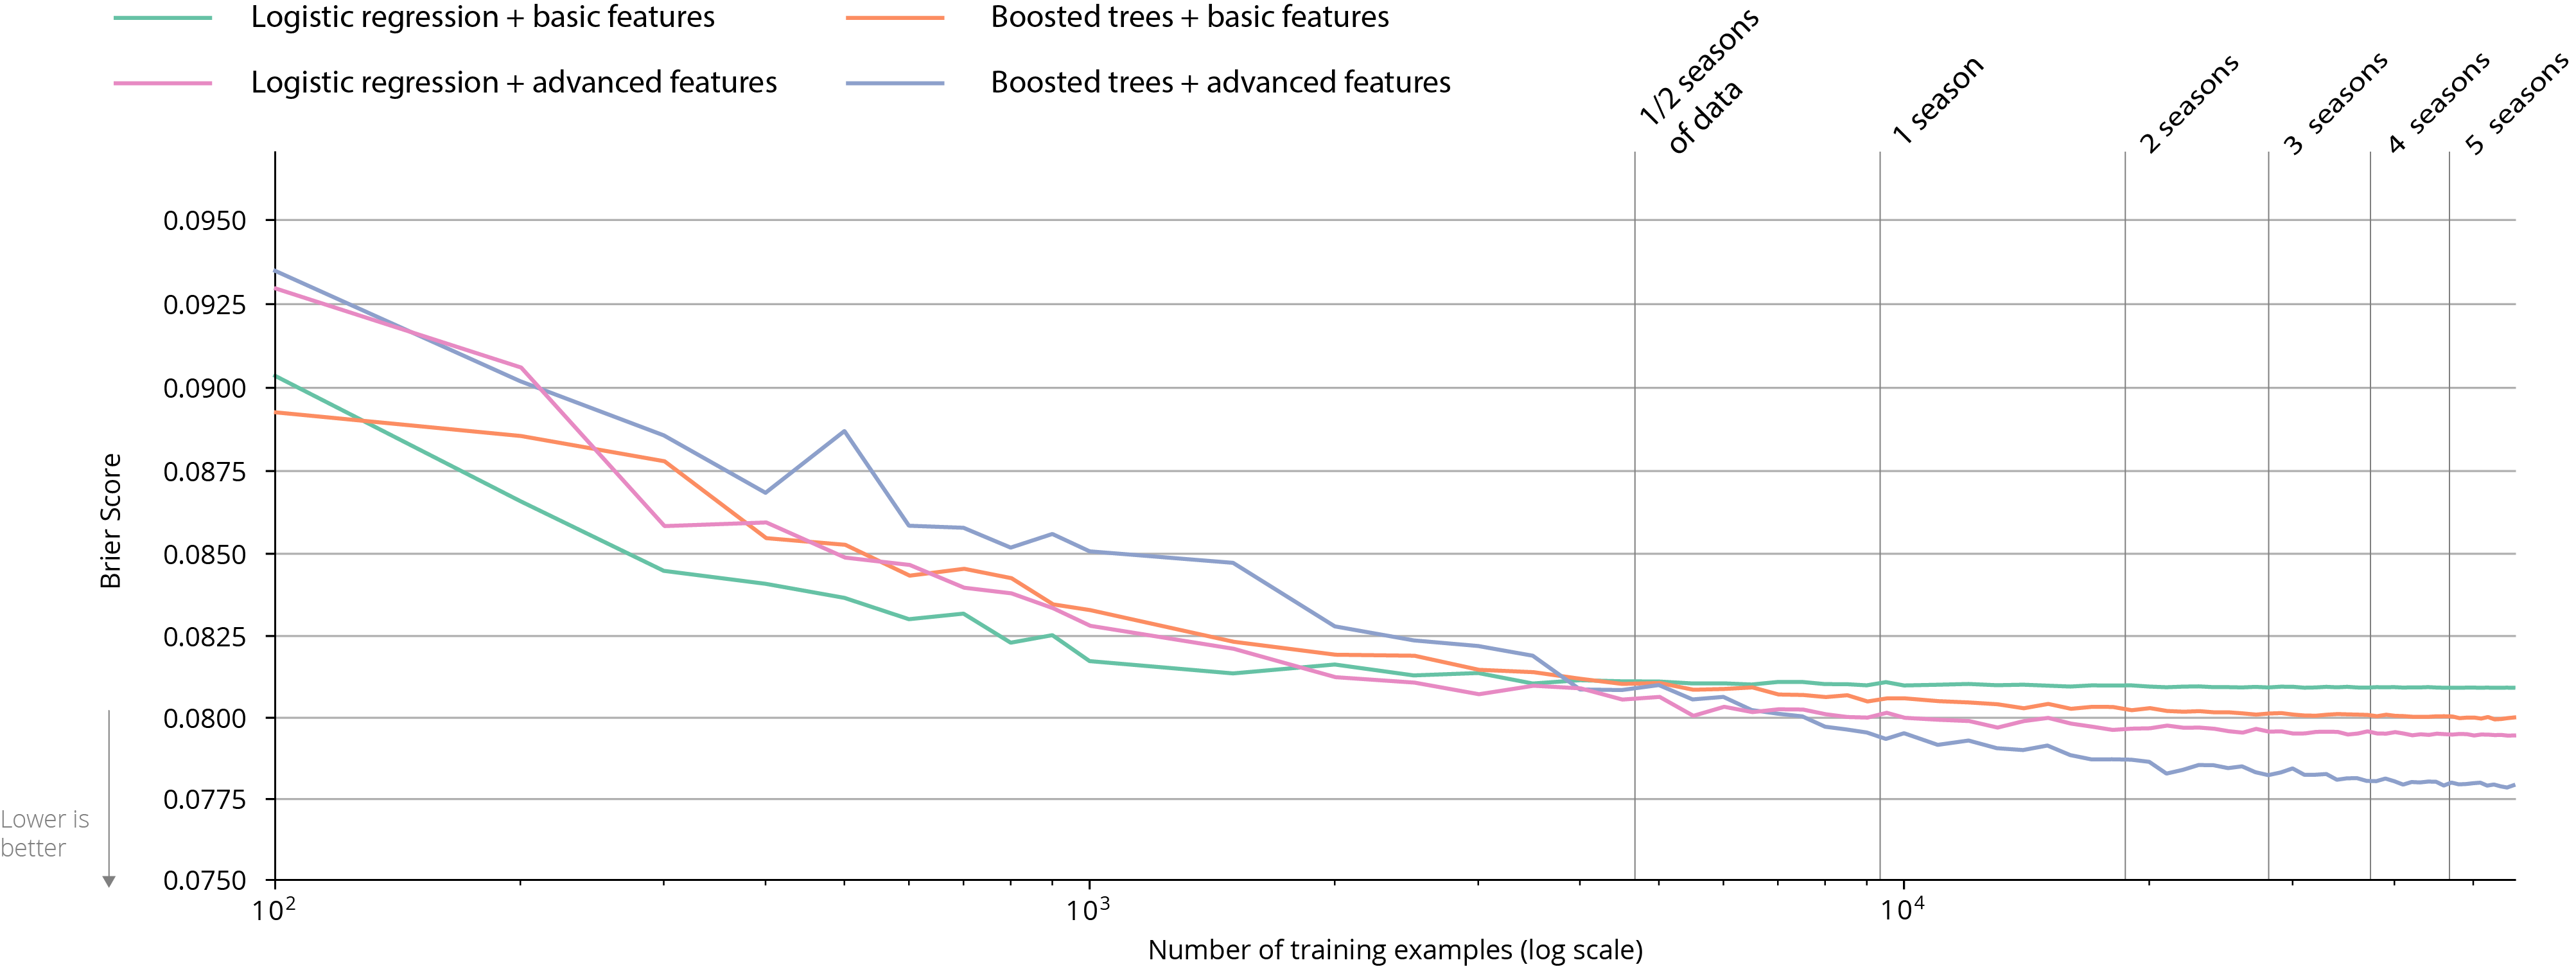
The performance of a logistic regression model using the basic feature set converges after around 6000 shots which is about 2/3 of a season of data. In contrast, the more complicated feature set requires about three times more data to converge. Of course, the more expressive feature set also results in better performance. Similarly, the more expressive gradient boosting model is more accurate and needs more data than the logistic regression model to converge. On the advanced feature set, it still slightly improves after five seasons of data.
From a machine learning perspective, these findings correspond to common knowledge. Typically, you want more many examples than features so when you restrict the size of the feature set you need less data to train an accurate model. Similarly, training more complex models like gradient boosted ensembles requires more data than simpler models like logistic regression.
2. Does data go out of date?
Conventional wisdom is that more recent data is more valuable than older data. Moreover, data may eventually go out of date. In soccer, the style of play changes over time. Thus, it is possible that the types and quality of shot attempts may vary over time. For example in the Premier League, both the number of shots and the average distance of shots has decreased in the past six seasons. Moreover, a player’s skill or ability to convert the attempts may also change.

In this vein, we now evaluate the effect of using older data to train an xG model on its performance. In this experiment, the shots from the 2018/2019 EPL season serve as the test set. We use two consecutive seasons of EPL data to form the training set and vary the years used, progressively making them older. The below table shows the Brier scores for all four of the models on this experiment:
| Brier score ▼ | AUROC |
|---|
| Basic Features | Advanced Features | |||
| Training seasons | Logistic Regression | XGBoost | Logistic Regression | XGBoost |
| 2016/17, 2017/18 | 0.0812 | 0.0806 | 0.0783 | 0.0783 |
| 2015/16, 2016/17 | 0.0812 | 0.0804 | 0.0786 | 0.0786 |
| 2014/15, 2015/16 | 0.0813 | 0.0803 | 0.0790 | 0.0790 |
| 2013/14, 2014/15 | 0.0813 | 0.0803 | 0.0789 | 0.0789 |
| 2012/13, 2013/14 | 0.0813 | 0.0803 | 0.0802 | 0.0802 |
Interestingly, using old data results in only a negligible performance hit. Perhaps we would need a much longer historical window to see larger changes in performance.
3. Are xG models league-specific?
Different leagues have different styles of play. However, given that more data enables learning more accurate models there is a tendency to combine data across different leagues when training a model. The question is what effect does this have? Would training a league-specific model result in better performance?
To answer this question, we consider data from the top-5 European leagues and the Dutch league. We create one test set for each league that consists of data from the 2018/2019 season and vary the data in the training set, considering three types of models:
- A league-specific model that uses only data from the same league as the test set
- A mixed model that uses data from the league in the test set plus other leagues, which is the standard approach
- A model that uses only data from other leagues
To ensure that these training sets are of equivalent size, we always take a random sample of 14,460 shot attempts from 2 seasons of data .
| Logistic regression + basic features ▼ | Logistic regression + advanced features | Boosted trees + basic features | Boosted trees + advanced features |
|---|
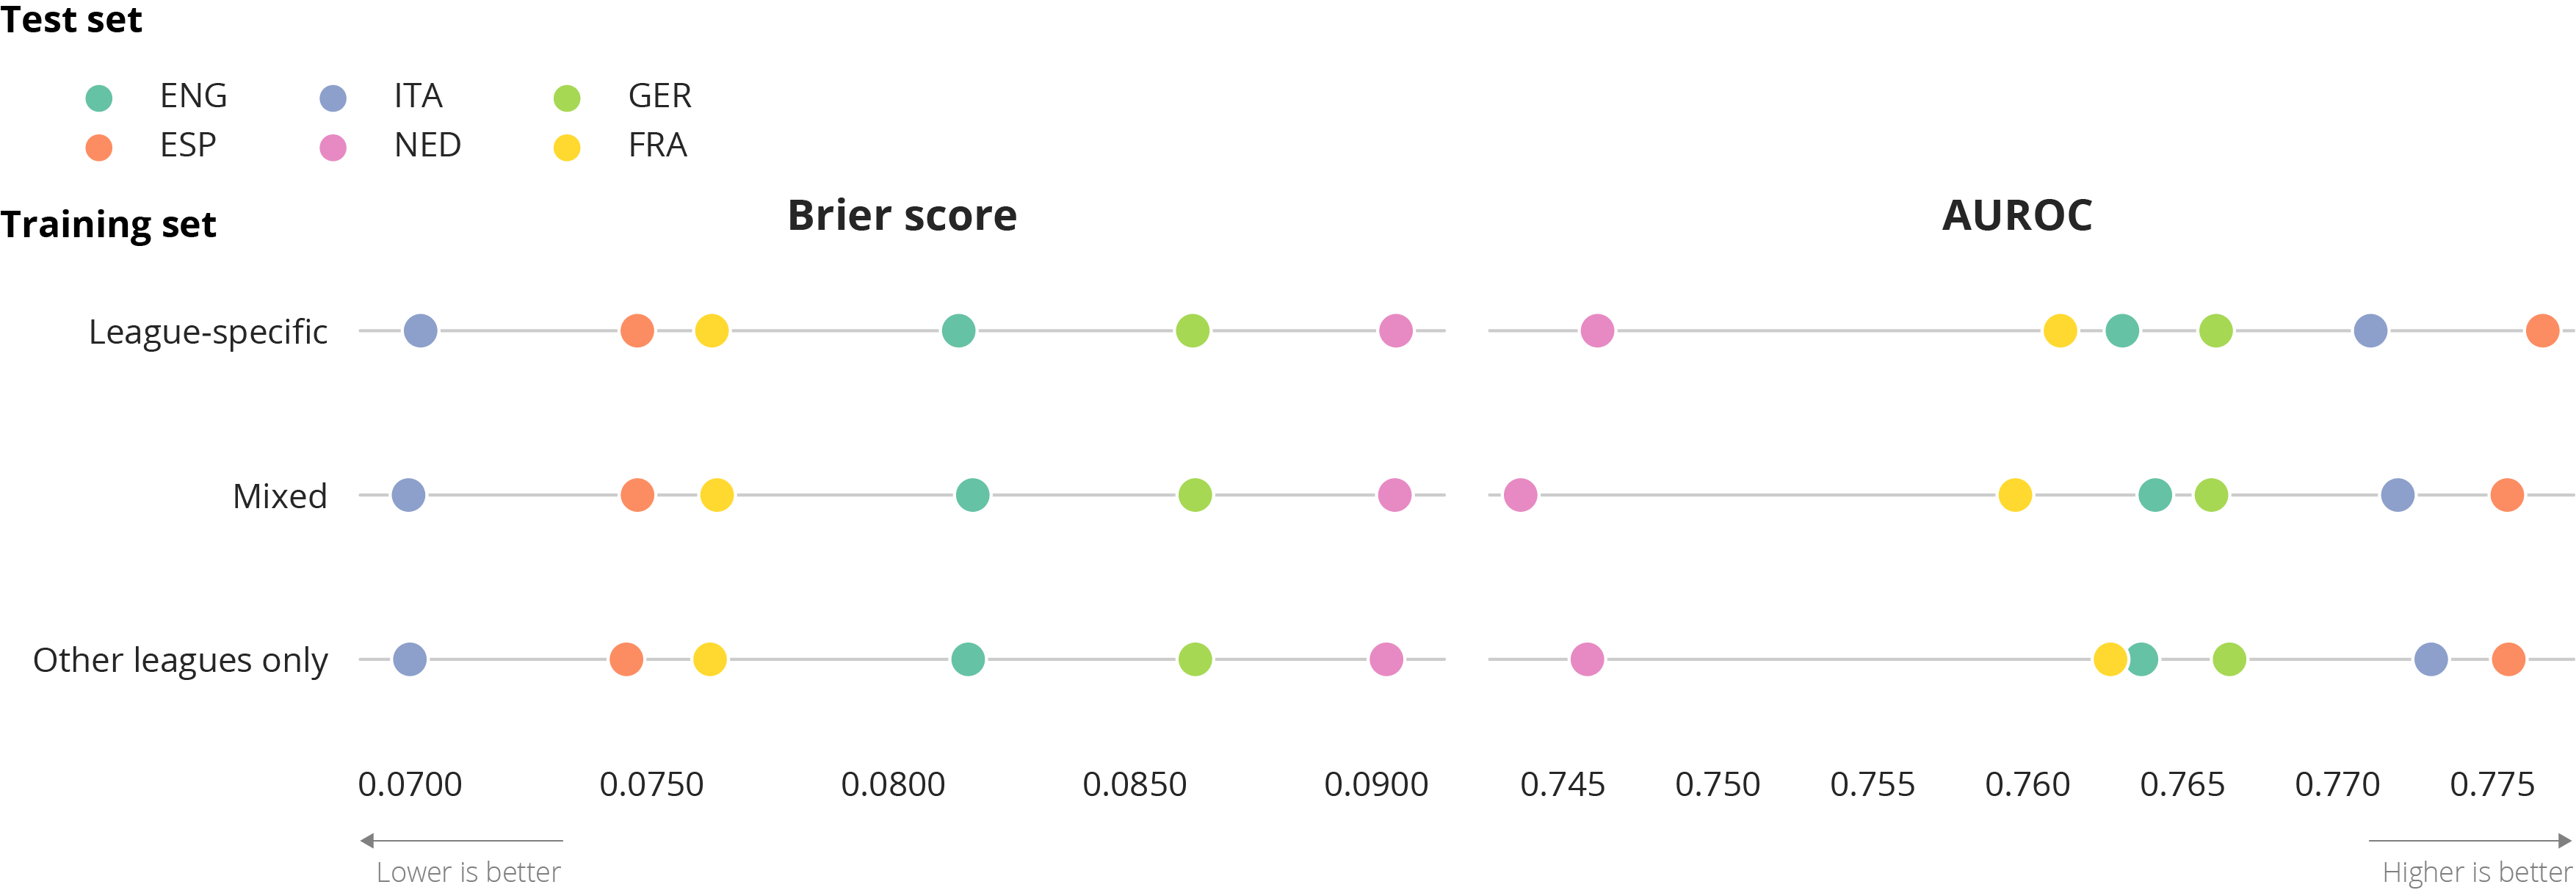
In contrast to what others have found, the league on which you train the models does not seem to have a big influence on the models’ accuracy. The league-specific model, mixed model and model trained on data from the other leagues perform equally on all leagues. Although these leagues definitely have different styles of play, these seem not to affect the scoring probabilities of a shot. This might be different in lower-level leagues where players have less intrinsic qualities, or in women’s soccer.
Which league is in the test set is much more significant: shots in the Dutch league seem much harder to predict than shots in the Serie A. In terms of AUROC scores, the Dutch league is even a clear outlier. Perhaps scoring is more affected by luck in the Dutch league, being a lower-level league and having less skilled players.
Finally, it is interesting to note that some models perform better on AUROC but worse on the Brier score and the other way around. This again illustrates why it is import to choose the right metric. First, they both measure different qualities of the model and the Brier score is simply better at capturing the qualities that we need. Second, the AUROC can be sensitive to class imbalance. Hence, the AUROC scores may be affected by the fraction of shot attempts that results in a goal in each league.
Conclusion
In this blog post, we showed that the amount of data needed to train an accurate xG model depends on the complexity of the learner and the number of features, with up to 5 seasons of data needed to train a complex gradient boosted trees model. Despite the style of play changing over time and varying between leagues, we did not find that using only recent data or league-specific models improves the accuracy significantly. Hence, if limited data is available, training models on less recent data or different leagues is a viable solution.
- Since penalties and free-kicks are relatively easy to predict, our xG models might seem less accurate than other models which include these penalty and free-kick shots.↩
- This version of the Brier score is only valid for binary classification. The original definition by Brier is applicable to multi-category classification as well. ↩

