TL;DR: We created an interactive tool to explore how VAEP values player actions in soccer. Try it out!
In soccer analytics, there is a tendency to sacrifice interpretability for performance. Almost all state-of-the-art models use complex black-box models like neural networks and ensembles of decision trees. Our own VAEP metric (What is VAEP?) that assesses the impact of individual actions performed by soccer players is no different.
VAEP uses a gradient boosted tree ensemble and a large set of features to estimate the probability of scoring in both the pre- and post-action game states. As such, game state values are derived from complex interactions among a large set of features. Explaining why a particular value is assigned to a specific game state is no longer straightforward in this framework.
This lack of interpretability is one of the main weaknesses of VAEP compared to a simpler framework such as expected Threat (xT). That’s why, in a recent meeting, Karun Singh proposed developing an interactive tool that would allow us to sketch fictitious game situations and explore how VAEP values them.
How the tool works
Starting from a historical game state, the tool allows you to alter all the attributes that VAEP uses to value an action and to explore how small changes in the game state affect the result. In the short clip below, we show how this works for the goal by Jesus against Wolverhampton in the 2018/19 season. Originally, Jesus’ shot gets a VAEP value of 0.58, but moving Jesus’ further away from the goal increases the VAEP value (because scoring becomes harder further away from the goal). Similarly, the VAEP value decreases a bit if you add one goal to the current scoreline (because scoring the opening goal is considered harder).
Use case: Maximizing scoring probabilities
Because the values that VAEP assigns to game states correspond to scoring probabilities, you can also use the tool to find out which actions lead to the highest probability of scoring. As an illustrative example, we compare crossing the ball early against dribbling past a defender to the goal line and subsequently passing the ball to the attacker.
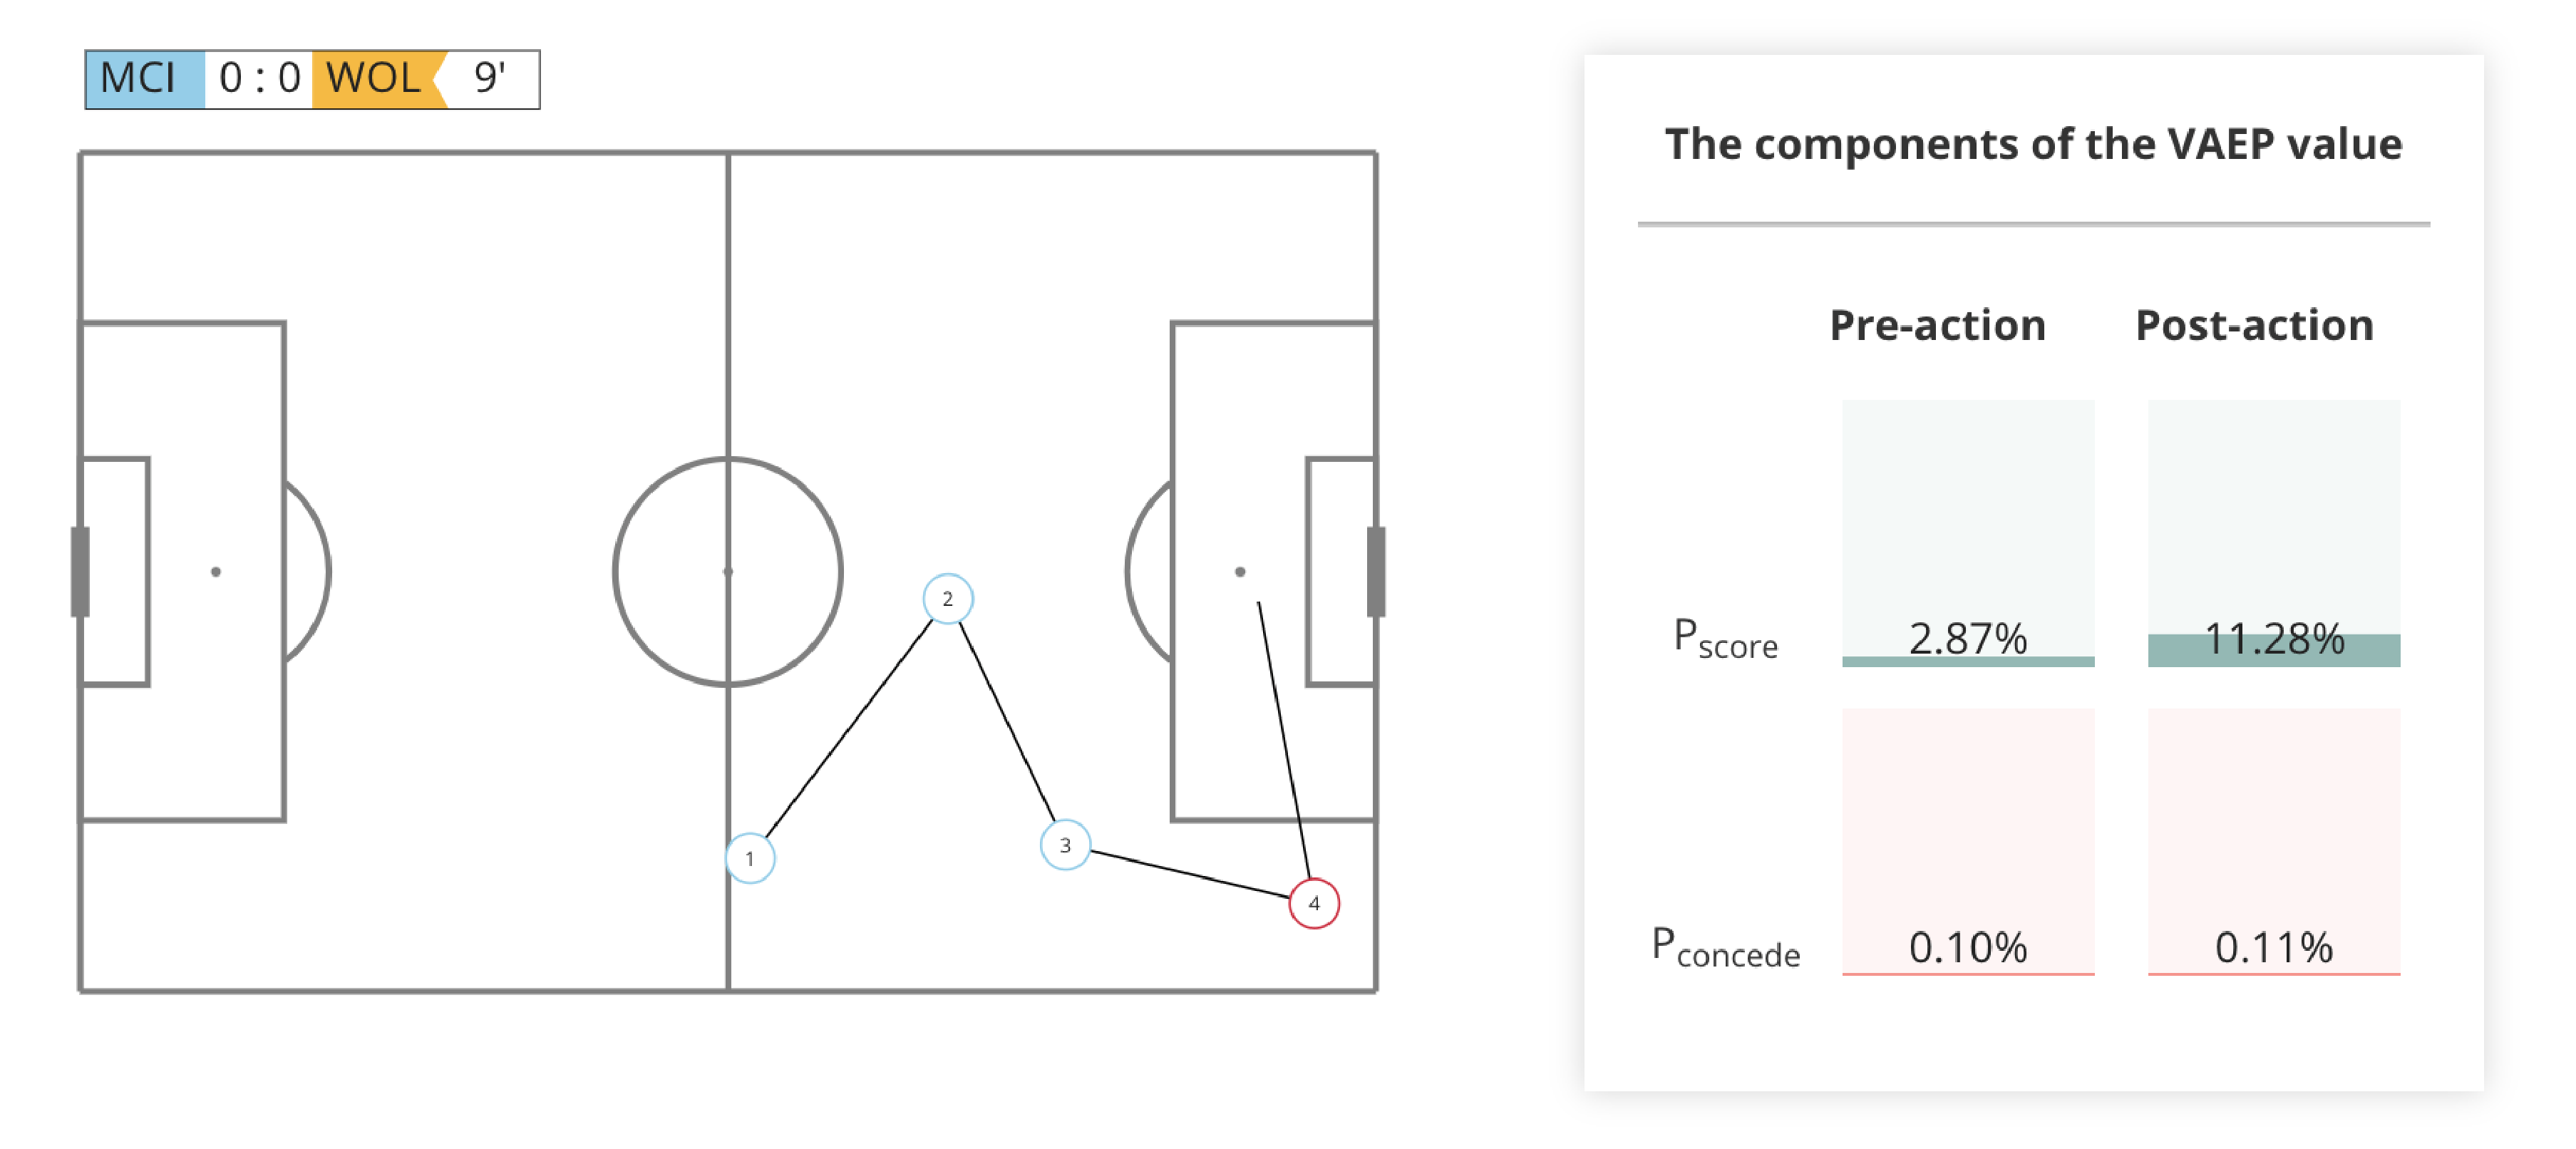
In the first scenario below, the winger crosses the ball towards the penalty spot immediately after receiving the ball. At the point where the winger receives the ball, his team has a fairly low scoring probability of 2.87%, but the cross increases it to 11.28%.

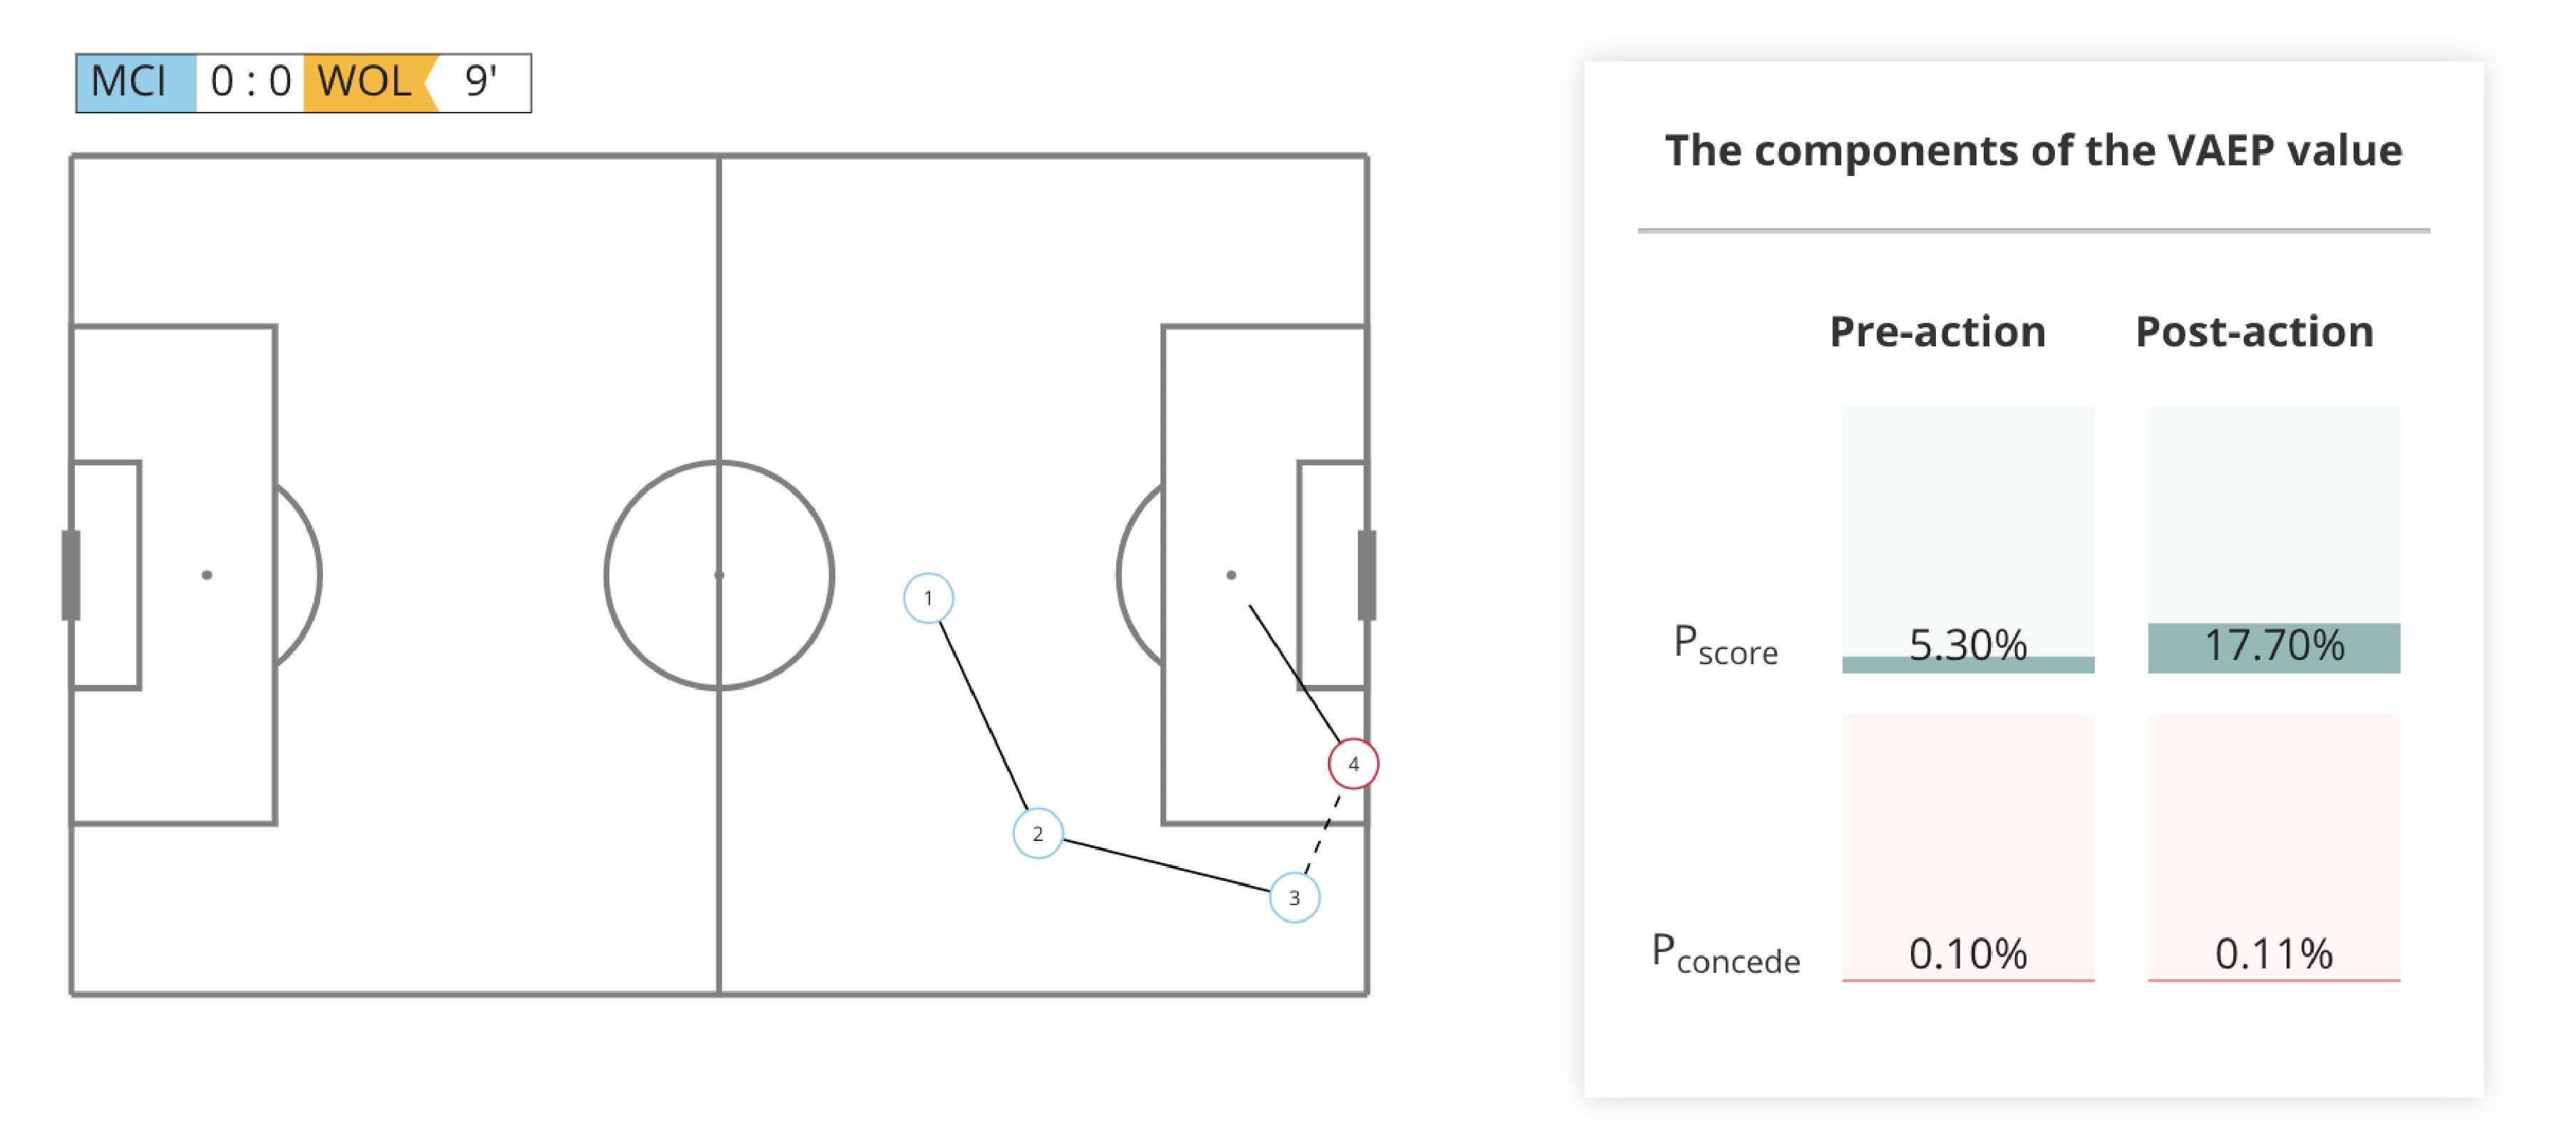
In the second scenario, the winger first takes on the defender and subsequently passes the ball. Notice how the scoring probability is significantly higher here.

Obviously, the risk of losing the ball before being able to cross it is also higher in the second scenario, but that is not considered by VAEP.