


The VAEP team have spent a lot of time discussing American Soccer Analysis’ g+ metric and their very thoughtful and illustrative comparison of the various emerging approaches (e.g., Opta’s Possession Value Added (PV+), Karun Singh’s Expected Threat (xT), and our very own Valuing Actions by Estimating Probabilities (VAEP) framework) to valuing on-the-ball actions from event stream data from professional soccer matches.
At a high level, VAEP and g+ are extremely similar. Both methods value each game situation in a soccer match by considering how likely it is to score and concede from that particular situation. Both methods exploit the fact that an action alters the game situation and value an action by the difference between the new situation’s value and the previous one’s value. This approach rewards players for increasing their team’s chance of scoring and decreasing their team’s chance of conceding. Therefore, the differences between VAEP and g+ will arise from technical choices made when converting the data into the feature-vector format used to train the gradient boosted ensemble that estimates the scoring and conceding probabilities.
In a similar spirit to American Soccer Analysis and to further develop the understanding of this exciting research field, we will succinctly describe what we feel are the four key differences between g+ and VAEP:
- Target variable in the prediction tasks
- Division of credit for valuable actions between players
- Feature set used to describe the game situation
- Number of prior actions considered
Now we briefly discuss the implications of these decisions.
1. Target variable in the prediction tasks
We feel that the most consequential difference between g+ and VAEP is in the choice of the target variable. In real-world tasks, the target variable can have a massive effect on the ability to learn a good model, with the Netflix challenge being a canonical example.1 While both methods aim to capture the odds of scoring and conceding, they do so in a different way:
- VAEP takes a window-based approach and trains a model to predict whether a goal is scored in the next 10 actions, which is a binary classification task.
- g+ takes a possession-based approach and trains a model to predict the possession’s xG, which is a regression task.
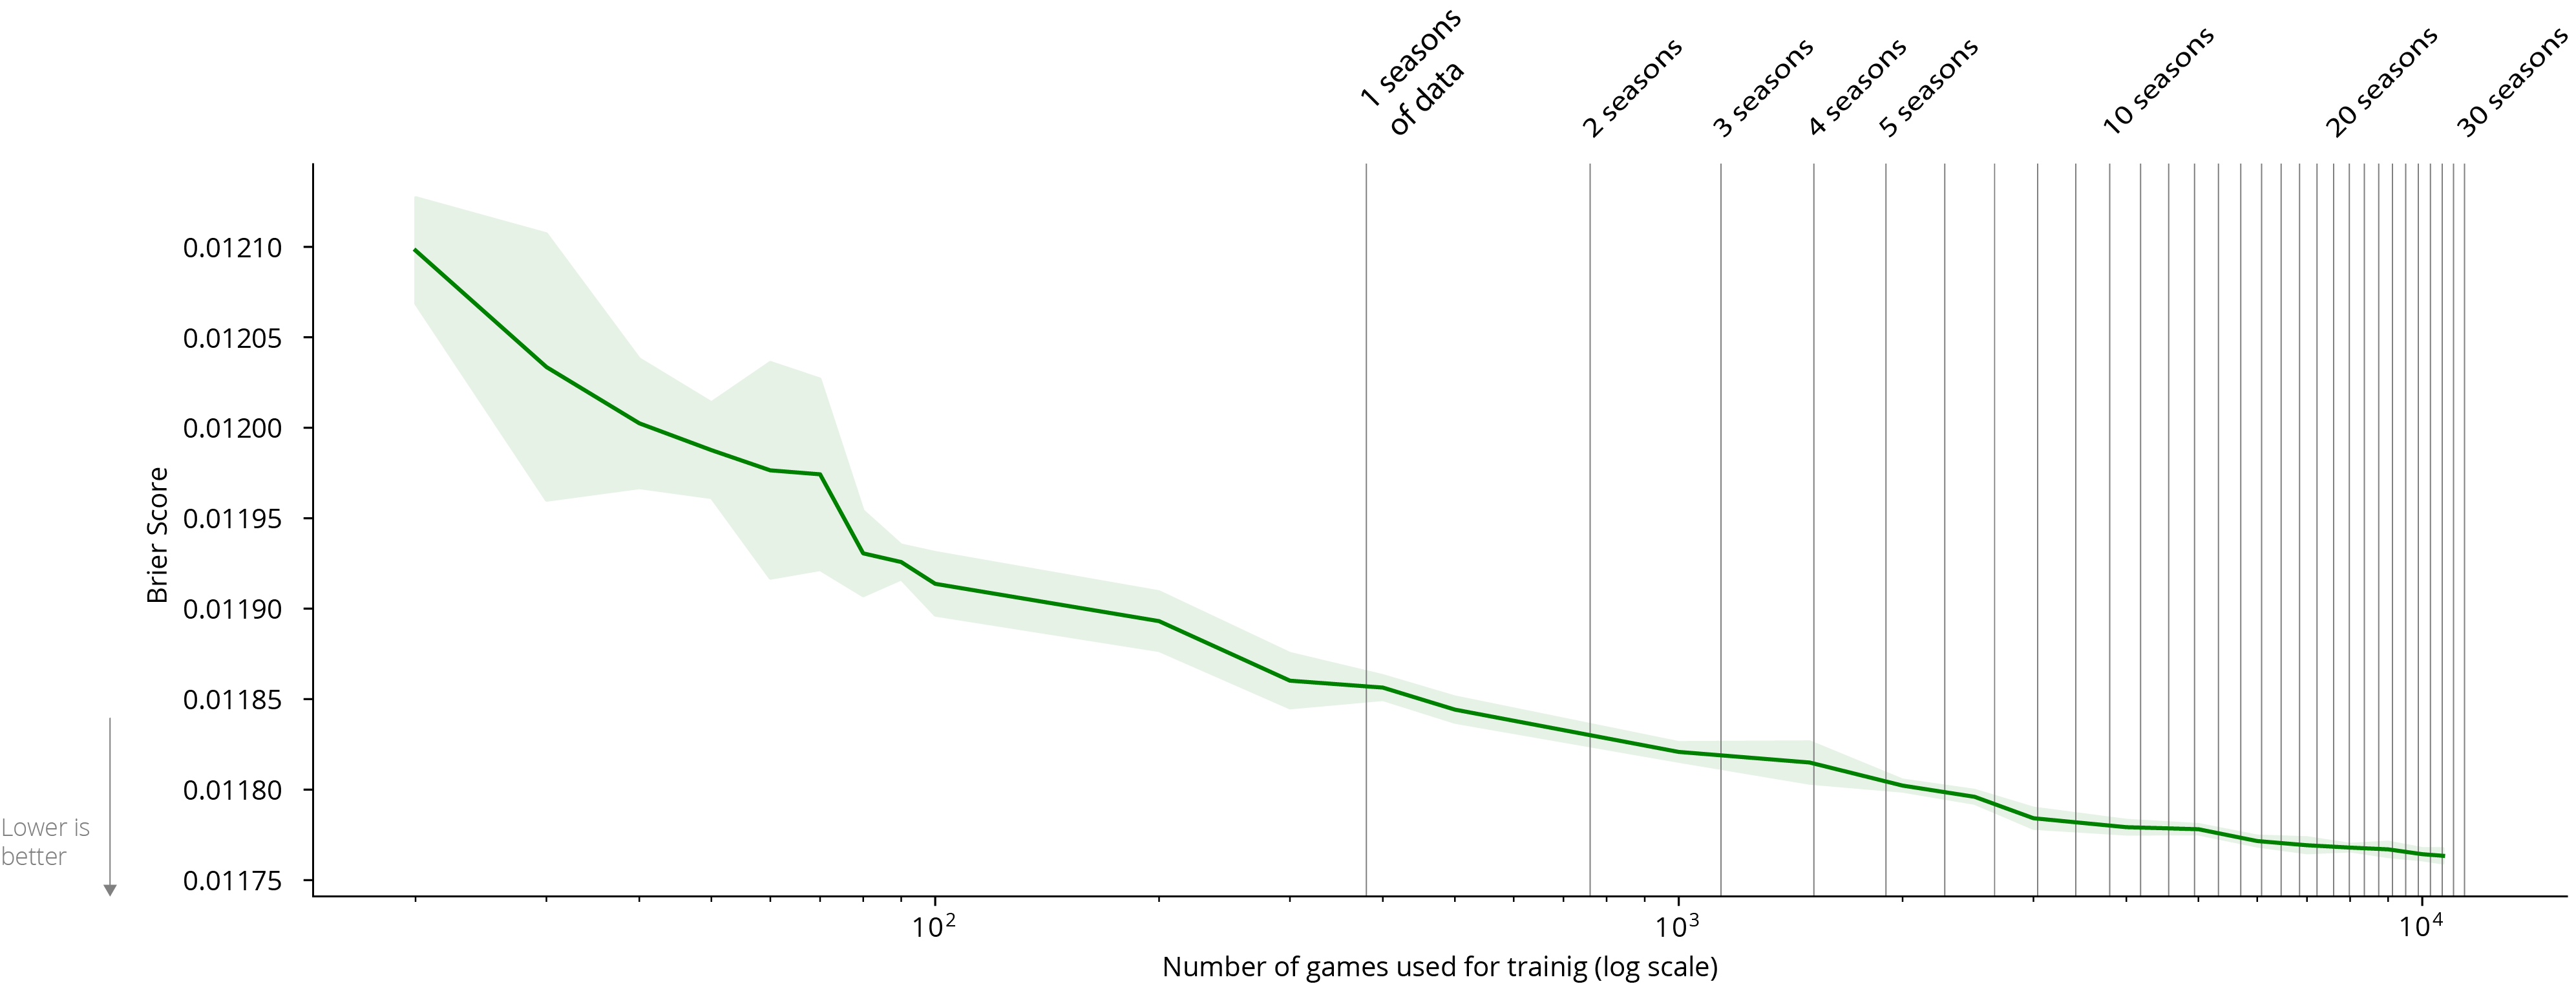
The primary goal of changing the target variable is to address the fact that the prediction problem is very imbalanced, which can cause problems for learners. Because goals are extremely rare in soccer with roughly 2.7 goals arising in the 2000 actions that constitute a match, VAEP’s models must pick up on a sparse signal in the data. In contrast, by predicting the possession’s xG, g+ has access to about 10 times more “positive” examples (i.e., examples with a non-zero label) since shots occur about 10 times as often as a goal. We speculate that g+‘s target variable enables training a model with less data than VAEP needs. This hunch is based on our knowledge of practical machine learning. Unfortunately we cannot empirically verify this without a publicly available implementation of g+. To give a sense about how much data is needed to train VAEP’s models, we include a learning curve below:2
| Probability of scoring ▼ | Probability of conceding |
|---|
However, g+‘s choice of using xG as the target variable raises a potential methodological concern. If the xG model is trained on the same data used to train the probability estimators for scoring and conceding, there is certainly a risk of overfitting. More subtly, and potentially more problematically, the same features used to determine the value of the target variable could also play a role in the model used to predict the target variable. To see this, consider the dribble by Lukaku in the World Cup game against Brazil, which is visualized below. An xG model could use information about this action (e.g., the horizontal velocity) when predicting the xG value of De Bruyne’s shot. Similarly, Lukaku’s action will be involved in constructing a feature vector for the model trained to predict the possession’s xG, which means that some of the feature values for this example will be correlated to the target value simply because of how the target value was constructed! Hence, there could be artificial correlations introduced into the data or leakage of information. Hopefully, this implementation detail will be more carefully explained.

2. Division of credit for valuable actions between players
A key decision is how to handle an action’s result. VAEP originally used the SPADL representation which considers an action’s results. In contrast, g+ uses a data representation similar to Atomic-SPADL, which effectively divorces an action from its results. The key difference between SPADL, Atomic-SPADL and g+ can be illustrated in how each representation handles a pass. SPADL treats a pass as a single action and assigns all credit to the player giving the pass. Atomic-SPADL sees giving and receiving a pass as two separate actions and splits the credit across the player who gives the pass and the player who receives the pass. Finally, g+ splits the credit up between the pass giver and the pass receiver based on the expected pass completion percentage, leveraging the intuition that more risky passes often require more work from the receiver to successfully complete.
Our prior blog post covered the effect of using SPADL versus Atomic-SPADL on VAEP. To summarize, moving to Atomic-SPADL decreases the importance of shots in the final VAEP rankings, which makes the VAEP rating more stable.
3. Feature set used to describe the game situation
Being able to accurately model how likely it is to score or concede in a game situation requires describing the relevant characteristics or features of the situation that affect these probabilities. For example, De Bruyne’s shot illustrated above partly resulted in a goal because Lukaku’s fast run created a lot of space. Against a set defence, a shot from that position would have had a much smaller probability of success. Designing features that are able to represent those aspects of the game situation that affect scoring will lead to more accurate predictions. More-or-less, VAEP and g+ consider a similar set of features. Some notable differences are that g+ defines features that capture properties of the entire possession sequence and that g+ tends to encode a bit more domain knowledge with features such as the penalty box indicator than VAEP does. However, the chosen features can have a massive impact on predictive performance. This impact can only be assessed via performing an empirical comparison similar in spirit to our work comparing and contrasting xT and VAEP. For a quick, high-level check, we report the top 10 players in the 2019 MLS season for passing:3
| # | Player | VAEP/90 | g+ |
|---|---|---|---|
| 1 | S. Blanco (Portland Timbers) | 0.25 | 0.16 |
| 2 | Carles Gil (New England Revolution) | 0.27 | 0.12 |
| 3 | M. Kaye (Los Angeles FC) | 0.29 | 0.12 |
| 4 | A. Romero Gamarra (New York Red Bulls) | 0.33 | 0.12 |
| 5 | Nani (Orlando City SC) | 0.22 | 0.10 |
| 6 | H. Medunjanin (Philadelphia Union) | 0.28 | 0.10 |
| 7 | Pozuelo (Toronto FC) | 0.17 | 0.09 |
| 8 | S. Salinas (San Jose Earthquakes) | 0.24 | 0.09 |
| 9 | E. Atuesta (Los Angeles FC) | 0.29 | 0.09 |
| 10 | M. Moralez (New York City FC) | 0.19 | 0.09 |
We notice that the overlap between the VAEP and g+ lists is quite high, with 8 names appearing in both lists.
4. Number of prior actions considered
Building on the prior point, both VAEP and g+ consider constructing features that describe the game situation based on a small number of prior actions. These features help place the current action in the right context. The number of prior actions considered affects the size of the feature set. VAEP considers the previous 3 actions, whereas g+ only considers 2 actions, but encodes some information about the entire possession sequence. The original version of the VAEP paper that appeared on arXiv in February 2018 empirically evaluated the effect of the number of previous actions on the predictive performance of the learned models.4 Below are the results:
| Number of prior actions | Logarithmic loss | ROC AUC | Brier score |
| 1 | 0.0548 | 0.7955 | 0.0107 |
| 2 | 0.0546 | 0.7973 | 0.0107 |
| 3 | 0.0546 | 0.7977 | 0.0107 |
| 4 | 0.0546 | 0.7970 | 0.0107 |
| 5 | 0.0547 | 0.7965 | 0.0107 |
The number of prior actions has a minimal impact on performance and is likely not a crucial design choice or differentiating factor.
Conclusions
VAEP and g+ are closely related. American Soccer Analysis has done a great job explaining their action rating system. If one uses the Atomic-SPADL representation with VAEP, we think the biggest difference in practice would boil down to the choice of the target variable. We would like to highlight that a central contribution of VAEP is the publicly available code base with a very permissive license, which we hope will serve as a valuable tool for people in the soccer analytics community.
- Practically, a key take away was designing an extremely good baseline predictor for a movie rating, and then training a model to predict the difference between the actual rating and the rating predicted by the baseline model.↩
- Each model was trained on five random samples of games from the 13/14 up to 17/18 seasons of the English, Spanish, German, French, Italian and Dutch leagues. The learning curves show the mean ± std Brier score on the 18/19 season of the same six leagues. ↩
- We only considered players who played 900 minutes, which is the equivalent of 10 full matches.↩
- Alas, this experiment was dropped in the published KDD 2019 paper due to space constraints.↩

